
Trading offers the opportunity to act independently without having to sell a product or manage inventory. Everything revolves around data, analysis, the right timing, and self-discipline. The Trading Setup Analyzer is an app that helps to better understand market movements and make structured trading decisions.
Adjustment Options
Every market behaves differently. With the numerous sliders in the app, you can customize your own trading profile:
- Trend Slider (Monthly/Daily): Control whether the analysis focuses more on long-term (monthly) or short-term (daily) movements.
- Tolerance Slider: Defines how sensitive signals react to smaller deviations.
- Volatility Sensitivity Slider: Determines how strongly price fluctuations affect the results.
- Structure Slider: Activates setups from price action structure such as BoS, Orderblock, Inducement, or Liquidity. From a value of 0.7, SMC setups are also included.
- Module Weights Slider: Adjust the importance of modules such as Support/Resistance, Volume Profiles, or Order Book data.
- Momentum & Breakout: Advanced parameters like Volume Multiplier, ATR-based Breakouts, or proximity to Support/Resistance can be fine-tuned.
Import and Export of Settings
To avoid configuring your preferences each time, they can be exported and re-imported. This makes it easy to save and restore setups.
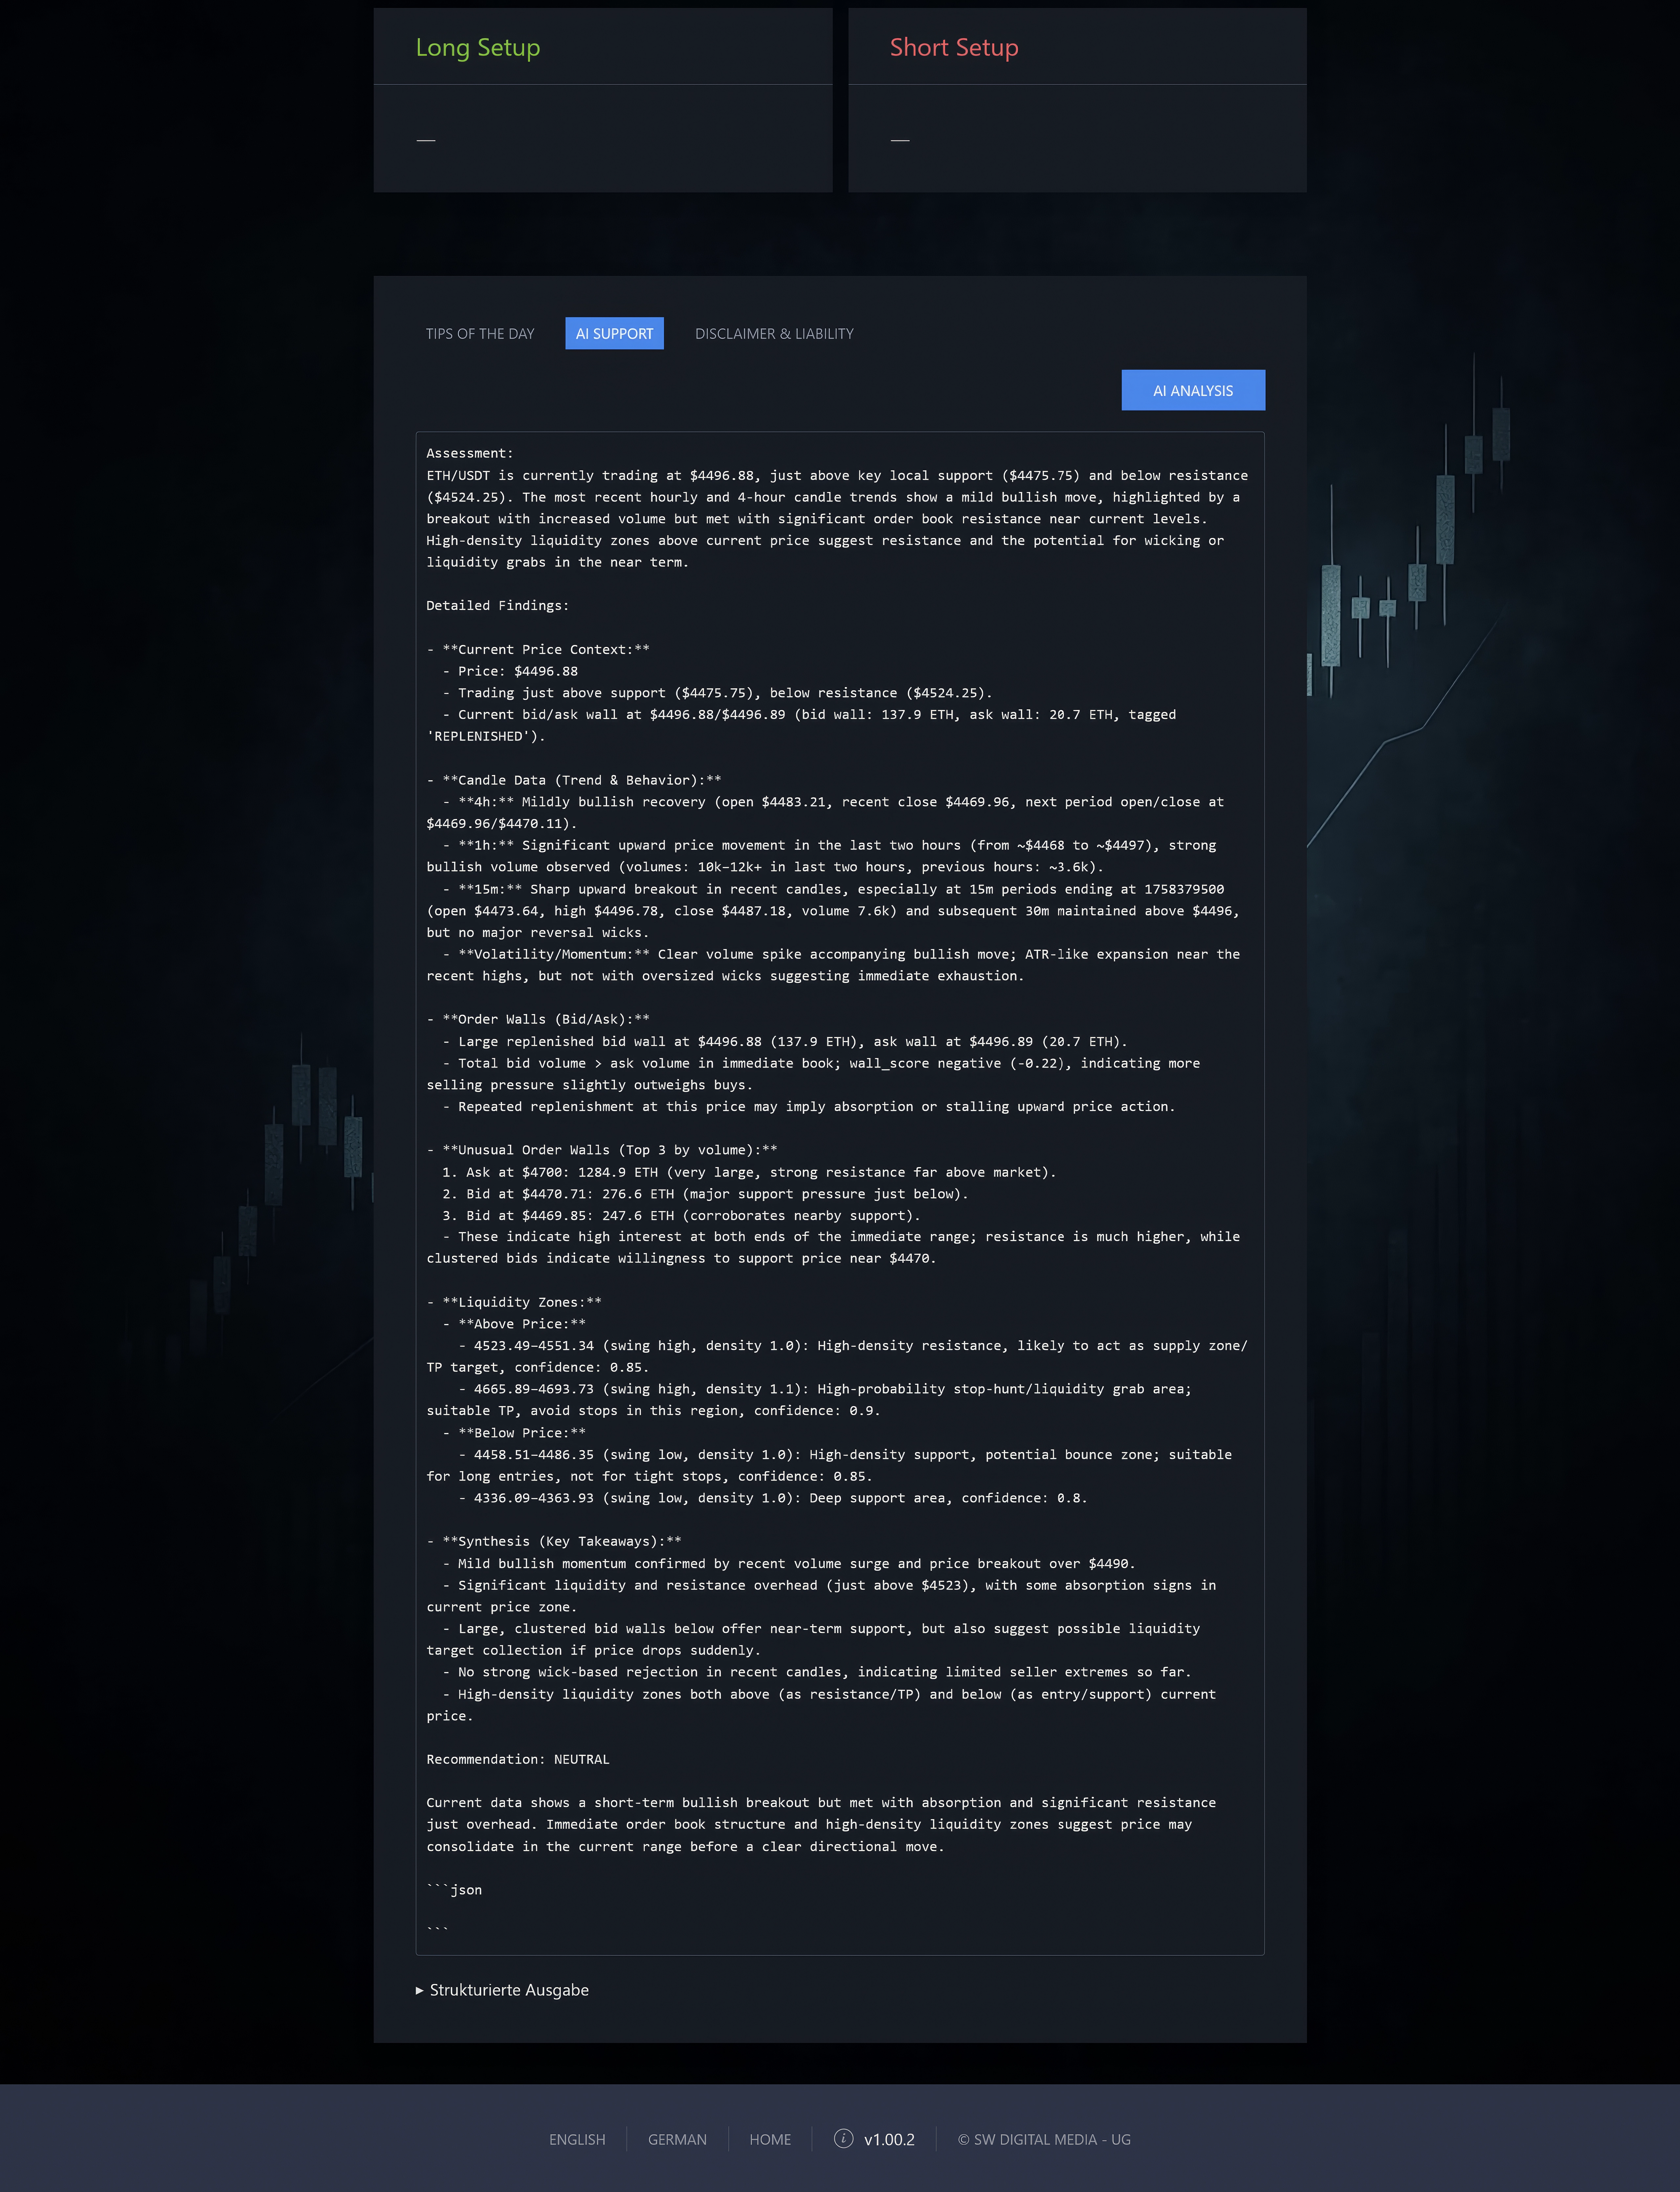
AI Analysis
With your own OpenAI API Key, market analyses can be performed directly by artificial intelligence. This feature allows interpreting data and deriving an additional market assessment.
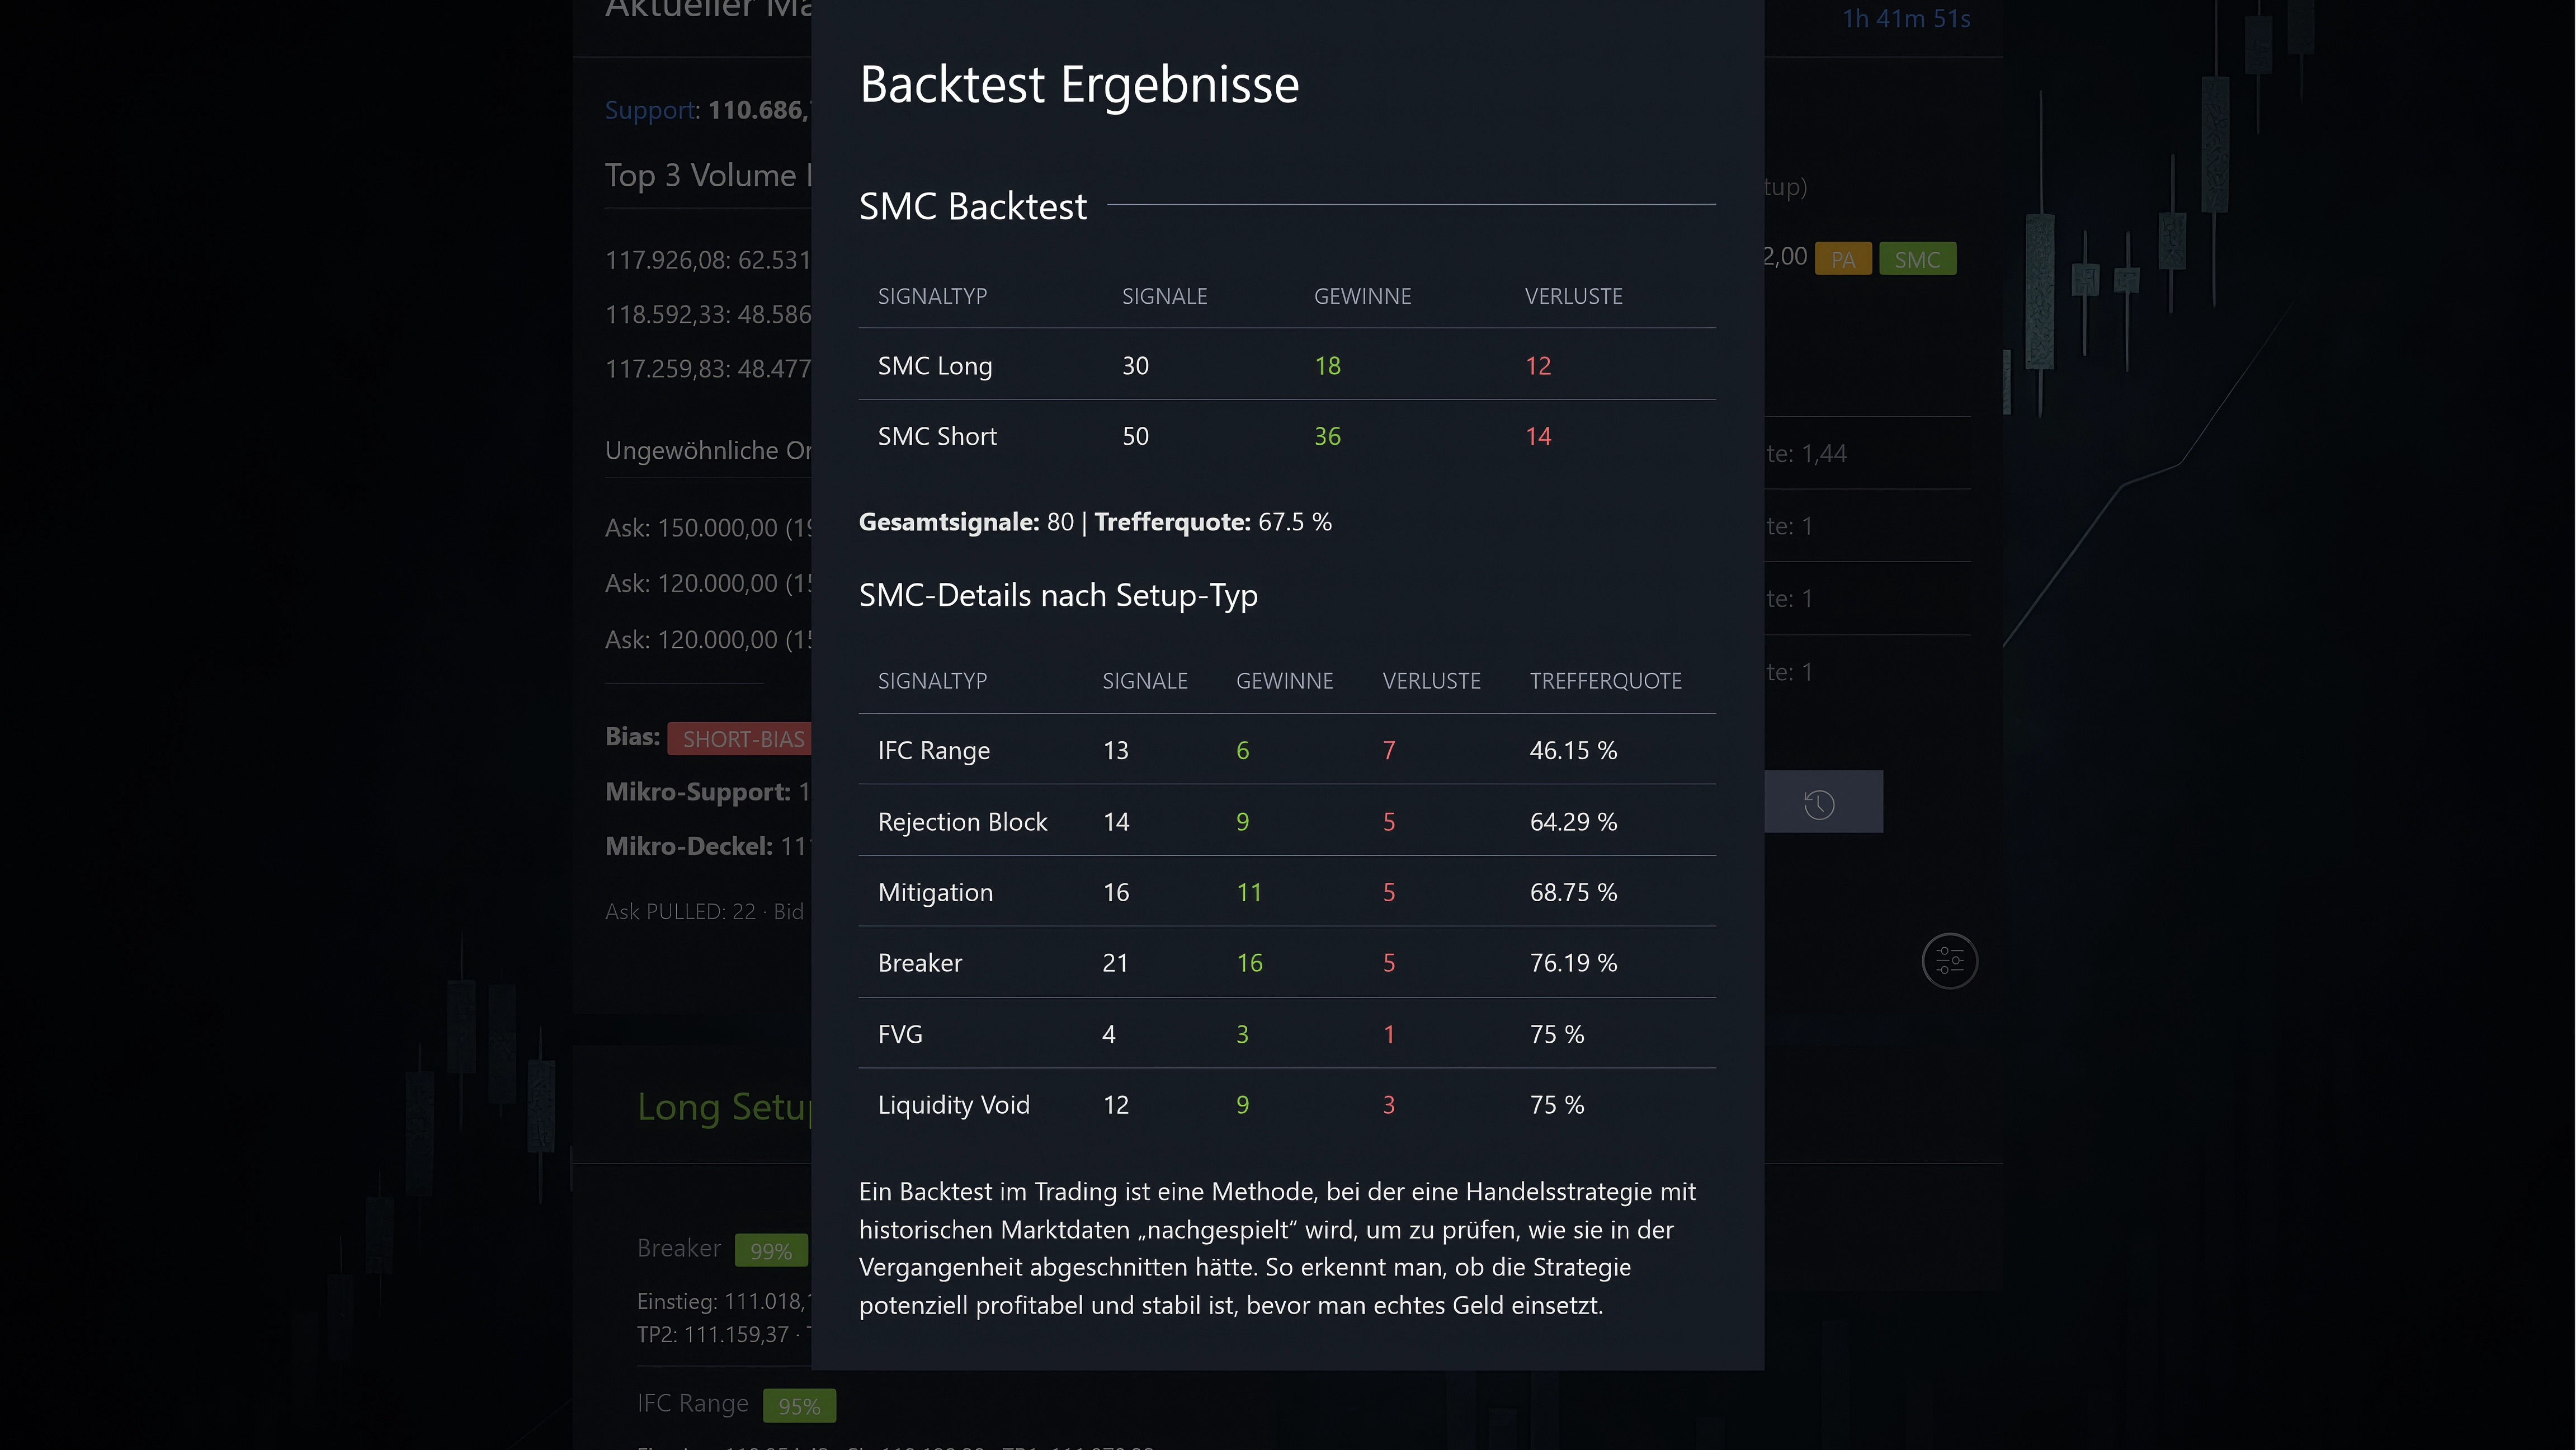
Backtest of Signals
Every trading idea is only as good as its history. With the Backtester, signals can be checked against past data. This reveals how robust a setup would have been over time.
Candlestick and Data Logic
The basis of every analysis is candlestick data. The app loads historical and current candlestick data in various intervals (1m, 15m, 1h, 4h).
In config.php, maximum bars and lookback values are defined. Example: for the 1h interval, 600 main candles and 24 auxiliary values are loaded.
These data are used to:
- Calculate Support and Resistance levels.
- Build Volume Profiles showing price levels with significant trading activity.
- Read Order Book Walls and check for anomalies such as “tested”, “filled”, “removed” or “replenished”.
- Determine Bias and Signals: a combination of trend direction, structural patterns, and order flow.
Order Book and Tagging
A central element is the order book walls. These are large buy or sell orders (bids/asks) that influence the market. The app tags these walls with:
- FILLED: a wall was actually traded.
- PULLED: a wall was removed.
- REPLENISHED: a wall was replenished.
- TESTED: the market briefly touched the wall.
This information directly influences bias and setup decisions.
How does data flow in the Trading Setup Analyzer?
The analyzer processes different data sources step by step. In the end, a trading signal is generated, which can optionally be reviewed by AI or tested with the backtester.
Step by step:
- Candlestick data provide the basis for price movements.
- Order Book adds current buy and sell walls.
- Bias results from weighting trend, structure, and walls.
- Signal indicates whether Long, Short, or Neutral is preferred.
- Backtest & History allow review and storage.
- AI Analysis provides an optional external assessment.
Saving Setups with History
Custom setups can be saved permanently and tracked via history. This creates a personal database of validated trading ideas.
A Look into the Configuration
The config.php file controls many core functions of the app. Key points include:
- DEMO_MODE: Defines whether the app runs in restricted demo mode or with full functionality.
- DEMO_FEATURES: Controls which features are enabled or disabled in demo mode (e.g., saving, backtesting, import/export, AI analysis).
- REMOTE_WALLS_BASE: Defines the base URL for fetching current order book data (“walls”) from the server.
- WALLS_MAX_ENTRIES: Limits the maximum number of stored order book entries to keep storage and UI efficient.
- WALL_TAG_RECENT_MS, MIN_FILL_RATIO, MIN_VOL_TO_TRACK, MIN_WALL_VOL: Technical parameters for tracking and evaluating order book walls.
- WEEKEND_BLOCK_SIGNALS: Controls whether signals are blocked on weekends. Default:
true. - $ALL_SYMBOLS: List of tradable symbols (e.g., BTC USDT, ETH USDT).
- $ALL_INTERVALS: Defines time intervals (1m, 15m, 1h, 4h) and their history settings.
- OPENAI_API_KEY: Placeholder for your personal OpenAI key, required for AI analysis.
- ENABLE_CONSOLE_LOG: Enables or disables extended debug logs.
Conclusion
The Trading Setup Analyzer combines market analysis, signal evaluation, order book data, and artificial intelligence in one interface. With flexible settings, AI support, backtests, and the ability to save setups, it provides a clear framework for making well-founded trading decisions.
New: Futures Sentiment (Binance)
The new Futures Sentiment widget shows the distribution of long/short ratios on the Binance Futures market. Within seconds you get a sentiment snapshot: how many accounts are net long vs. net short? In addition, long/short data for top traders (by margin balance) is displayed.
- Global (all accounts): Ratio of long to short accounts for the selected interval (e.g., 5 minutes).
- Top traders (accounts): Long/short share among the top 20% by margin balance.
- Top traders (positions): Long/short share of open positions held by top traders.
- Live usage: The widget updates periodically (default: every 5 minutes) and shows the latest timestamp.
Demo mode: For fairness and resource protection, top-trader values are replaced by a short notice in the demo.
The refresh interval is set to 1h (instead of 5m live) so you can see how it works without all details.
Use case: If futures sentiment diverges significantly from your own bias, it may hint at a potential counter-move or a riskier environment. Combined with order book walls, structure, and momentum signals, you get a more robust picture.
Trading Performance Overview & Reward to Risk Ratio Calculator (RRR)
The Trading Performance Overview helps you keep track of your trades. The module combines a trade log (entries, stop-loss, partial profits) with an integrated RRR Calculator (Risk–Reward Ratio). This way, you see not only individual setups but also the development of your overall performance.
- Trade entry: Store entry, stop-loss, take-profit targets, position size, and leverage.
- Automatic RRR check: The RRR is calculated from TP/SL distance and fees; percentage inputs (e.g., “TP 8%”) are supported. If leverage is used, risk and reward are scaled accordingly.
- Notes & history: Add comments to each trade (e.g., “RRR 2.15 · Δ+6.00% / Δ−2.79%”). The history reveals which parameters work in practice.
- Overview widgets: Totals and averages (hit rate, average RRR, net return) provide guidance for optimization.
Why RRR? A solid risk–reward ratio ensures that single losing trades do not dominate overall performance. Consistently trading only setups with sufficient RRR stabilizes the equity curve—especially when combined with proper risk management and the analyzer’s signals.
How to use both new modules together
- Check bias: Determine your base bias (Long/Short/Neutral) using trend/structure/order flow.
- Align sentiment: Verify whether futures sentiment confirms or warns against your bias.
- Plan the setup: Define entry, SL, TP(s) and check the RRR.
- Log the trade: Save the trade in the Performance Overview—including a short note.
- Evaluate: Use the summary metrics to iteratively refine your parameters (tolerance/structure/momentum).
Pro tip: Only trade a setup when bias, structure/order flow, and RRR align at the same time. If sentiment diverges strongly, reduce position size or wait for confirmation.
")